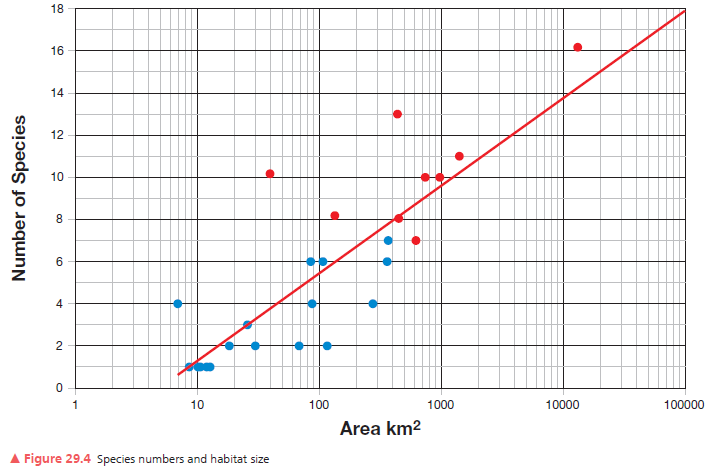
Plot the biodiversity and area values on Figure 29.4. The values for the first 10 forest islands and the trend line have been plotted for you.
What will be an ideal response?
Activity

You might also like to view...
During the Mesozoic Period, there was a/an ___________ off the western coast of North
America. Fill in the blank(s) with the appropriate word(s).
If you have removed half of Block A, how much of the remaining block will be exposed above water?
a. 25% b. 35% c. 50% d. 75%
The Great Lakes are sensitive to pollution because ____ of the water that enters the lakes is flushed out via the St. Lawrence River.
A. 25% B. 10% C. about half D. less than 1% E. most
Hurricanes cause a regional rise in sea level (dome of water) that can result in a very dangerous phenomenon known as storm surge. What best explains the cause for this rise in sea level?
A. convergence of tides and longshore currents B. convergence of high winds and longshore currents C. heavy rains within the storm D. high winds and lower air pressure within the storm E. shallow water near the shoreline