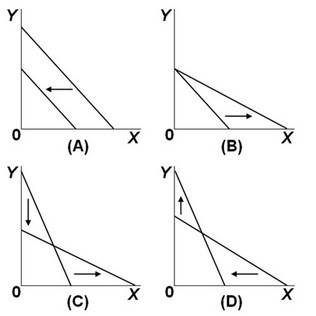
 Refer to the above graphs. Which of the above pairs of budget constraint lines illustrates a decrease in the price of good X and an increase in the price of good Y?
A. Graph A
B. Graph B
C. Graph C
D. Graph D
Answer: C
You might also like to view...
Refer to the scenario above. Which of the following strategy combinations denote a Nash equilibrium?
A) (Left, Left) B) (Left, Right) C) (Right, Left ) D) (Right, Right)
According to a study of the U.S. demand for alcoholic beverages, the price elasticity of demand for beer is -0.30. Which of the following could explain why the price elasticity of demand for beer is low?
A) More and more people are switching to wine and cocktails rather than beer. B) Beer is an inferior alcoholic beverage. C) There are only a few major suppliers of beer. D) The price of beer is relatively low and for many people it is a habit forming product.
As we move downward along a demand curve for apples,
A) consumer well-being decreases. B) the marginal utility of apples decreases. C) the marginal utility of apples increases. D) Both A and B are true. E) Both A and C are true.
_____________ is the tendency of people to refuse to accept fair gambles
Fill in the blank(s) with the appropriate word(s).