Figure 11-3
?
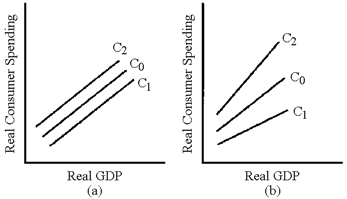
In Figure 11-3, which line represents the change in the consumption schedule caused by an increase in the residential property tax?
A. C1 in graph (a)
B. C2 in graph (a)
C. C1 in graph (b)
D. C2 in graph (b)
Answer: A
You might also like to view...
The economist that originated the idea that government can correct externalities through taxes and subsidization is:
A. John Nash. B. Arthur Cecil Pigou. C. Ronald Coase. D. Theodore Groves.
High-powered money minus reserves equals
A) reserves. B) currency in circulation. C) the monetary base. D) the nonborrowed base.
The use of collateral
A) allows banks to charge higher interest rates on loans. B) makes it more costly for borrowers to take advantage of their asymmetric information. C) makes it more costly for lenders to take advantage of their asymmetric information. D) has important tax implications for both borrowers and lenders.
Suppose the corn-producing industry of the U.S. is a price taker in the world market and government puts a ban on imports. The corn industry also receives subsidy from the home government. Then
A) social welfare will increase if the ban on imports is removed. B) everyone will be better off if both ban on imports and subsidy are removed. C) social efficiency will be improved if both ban on imports and subsidy are removed. D) the deadweight loss is reduced if subsidy is removed.