The total product curve graphically shows the:
A. Minimum level of output that can be produced by a quantity of a variable resource holding constant the quantity of other resources
B. Minimum level of output that can be produced by a quantity of a fixed resource letting other resources vary
C. Maximum level of output that can be produced by a quantity of a fixed resource letting other resources vary
D. Maximum level of output that can be produced by a quantity of a variable resource holding constant the quantity of other resources
D. Maximum level of output that can be produced by a quantity of a variable resource holding constant the quantity of other resources
You might also like to view...
In the figure above, if a tax of $2 per widget is imposed on sellers, then the after-tax amount per widget received by the seller will be
A) more than or equal to $8. B) between $8 and $6. C) $6. D) less than $6.
Suppose that the bank has the following balance sheet:
Assets Liabilities Reserves $75,000 Deposits $500,000 Loans $430,000 Net worth $5,000 If the required reserve ratio is 10 percent, what is the maximum the bank can loan out? Suppose the bank makes this loan and the borrower spends the money, which is deposited in a different bank. Show the impact of these transactions on the bank's balance sheet.
You are an analyst with a perfectly competitive firm that makes DRAM memory chips. You must manufacture the chips before you know what the demand will be. If demand turns out to be high, then producing where E[MR] = MC rather than where MRH = MC lowers your profit by an amount equal to ________.
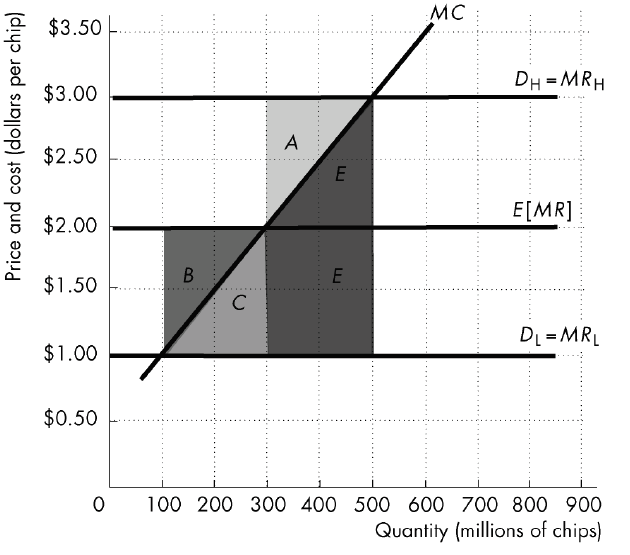
A) area A
B) area A plus the trapazoidal area marked by E and E
C) the trapezoidal area marked by E and E
D) area B + area C
M1 money includes all but which one of the following?
a. Savings accounts b. Paper money c. Coins d. Checkable deposits