Explain how the graph of f can be obtained from the graph of y =  or y =
  . f(x) =
A. Stretch the graph of y =  vertically by a factor of 8 and shift to the right 4 units.
B. Stretch the graph of y =  vertically by a factor of 8, reflect across the x-axis, and shift to the left 4 units.
C. Stretch the graph of y =  vertically by a factor of 8, reflect across the x-axis, and shift to the right 4 units.
D. Stretch the graph of y =  vertically by a factor of 8 and shift to the left 4 units.
Answer: B
You might also like to view...
Solve the problem.A square plate 2 m on a side is placed on a vertical wall 2 m below the surface of a pool filled with water. On which plate in the figure is the force greater? Try to anticipate the answer and then compute the force on each plate. Round to three decimal places when appropriate. 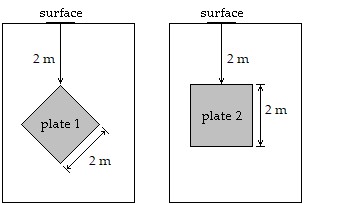
A. plate 2 plate 1: 117,600 N plate 2: 133,837.172 N B. plate 2 plate 1: 58,800 N plate 2: 66,918.586 N C. plate 1 plate 1: 66,918.586 N plate 2: 58,800 N D. plate 1 plate 1: 133,837.172 N plate 2: 117,600 N
The line graph shows the recorded hourly temperatures in degrees Fahrenheit at an airport.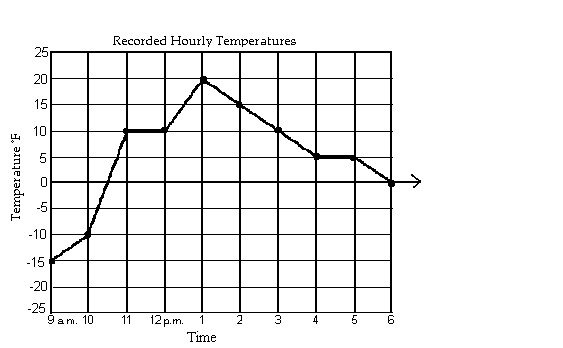 Estimate the temperature at 1:30 p.m.
A. 15°F B. 18°F C. -15°F D. -18°F
Add.-6.0 + (-8.4)
A. 2.4 B. 14.4 C. -14.4 D. -2.4
Write the inequality obtained by performing the indicated operation on the given inequality.Subtract 1 from each side of the inequality 4 + 4x ? 2.
A. 3 + 3x ? 1 B. 3 + 3x ? 1 C. 3 + 4x ? 1 D. 3 + 4x ? 1