Refer to the below table. How many units of labor will this firm hire to maximize its profits?
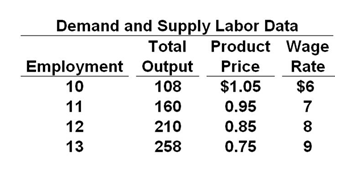
A. 10
B. 11
C. 12
D. 13
C. 12
You might also like to view...
Figure 4.5 illustrates a set of supply and demand curves for hamburgers. An increase in supply and an increase in demand are represented by a movement from
A) point c to point a. B) point d to point a. C) point d to point b. D) point b to point c.
According to the Phillips curve, unemployment and inflation are positively related in
a. the short run and in the long run. b. the short run, but not in the long run. c. the long run, but not in the short run. d. neither the long run nor the short run.
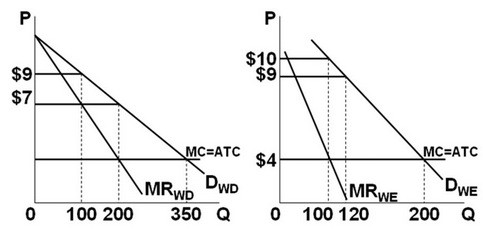 Refer to the figures above. Suppose the graphs represent the demand for use of a local golf course for which there is no significant competition (it has a local monopoly). P denotes the price of a round of golf and Q is the quantity of rounds sold each day. If the left graph represents the demand during weekdays and the right graph the weekend demand, then over the course of a full seven-day week this price-discriminating, profit-maximizing golf course should sell a total of:
A. 1200 rounds. B. 900 rounds. C. 740 rounds. D. 300 rounds.
Compared to a monopolistically competitive firm having the same cost curves, a perfectly competitive firm produces ________ output and charges a ________ price.
A. less; higher B. more; lower C. more; higher D. less; lower