The following double-bar graph illustrates the revenue for a company for the four quarters of the year for two different years. Use the graph to answer the question. 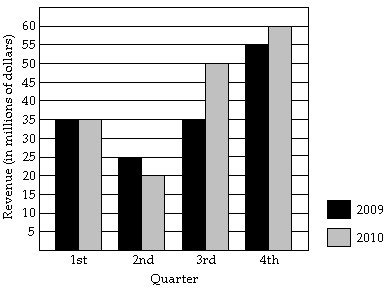 In what quarter was the revenue the least for 2010?
A. third quarter
B. second quarter
C. fourth quarter
D. first quarter
Answer: B
Mathematics
You might also like to view...
Evaluate the determinant.
A. -30 B. 0 C. 30 D. -16
Mathematics
Evaluate the definite integral.
?
 ?
?
A. 
B. 
C. 
D. 
E. 
Mathematics
Determine whether the infinite geometric series converges. If the series converges, determine the limit.60 + 12 +  +
+  + ...
+ ...
A. Converges; 50 B. Converges; - 9360 C. Converges; 75 D. Diverges
Mathematics
Multiply. 2
2
A. y - 22
B. y - 2 + 22
+ 22
C. y - 2 - 22
- 22
D. y + 2 +
+ 
Mathematics