Solve the problem.A study was conducted to compare the average time spent in the lab each week versus course grade for computer students. The results are recorded in the table below. Find the equation of the least-squares regression line that models the data. Number of hours spent in lab Grade (percent) 10 96 11 51 16 62 9 58 7 89 15 81 16 46 10 51
A. y ? 1.86 + 88.6x
B. y ? 0.930 + 44.3x
C. y ? 44.3 + 0.930x
D. y ? 88.6 - 1.86x
Answer: D
You might also like to view...
Solve the problem.If v = 2i - 4j - 5k and w = 5i + 6k, then evaluate v × w.
A. -24i + 13j - 20k B. 20i + 24j + 37k C. 20i + 40j - 8k D. -24i - 37j + 20k
Find the probability of the event.When a single card is drawn from an ordinary 52-card deck, find the probability of getting a jack.
A. 
B. 
C. 
D. 
Solve.A number is doubled and then decreased by 14. The result is 72. What is the original number?
A. 29 B. 43 C. 172 D. -29
Use the given table to find the probability of the indicated event. Round your answer to the nearest thousandth.College students were given three choices of pizza toppings and asked to choose one favorite. The following table shows the results.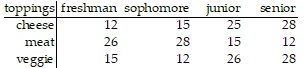 A randomly selected student prefers a cheese topping.
A. .331 B. .491 C. .050 D. .150