Solve the problem.The following data represents the normal monthly precipitation for a certain city in Arkansas. 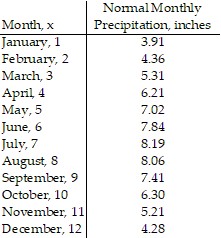 Draw a scatter diagram of the data for one period. Find the sinusoidal function of the form
  that fits the data. Draw the sinusoidal function on the scatter diagram. Use a graphing utility to find the sinusoidal function of best fit. Draw the sinusoidal function of best fit on the scatter diagram.
What will be an ideal response?
y = 2.17 sin (0.49x - 1.88) + 6.02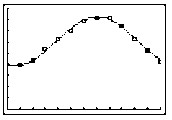
You might also like to view...
Use properties of logarithms to expand the logarithmic expression as much as possible. Where possible, evaluate logarithmic expressions.log
A. log x + 3 B. 1,000x C. -30x D. log x -3
Solve the equation.  x = 8
x = 8
A. 
B. {3}
C. 
D. {-3}
Use a proportion to solve the problem.It takes 40 oz of grass seed to seed 2160 ft2 of lawn. At this rate, about how much would be needed for  of lawn? Round to the nearest whole number.
A. 201 oz B. 204 oz C. 594,000 oz D. 198 oz
Determine whether the relation represents a function. If it is a function, state the domain and range.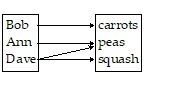
A. function domain: {carrots, peas, squash} range: {Bob, Ann, Dave} B. function domain: {Bob, Ann, Dave} range: {carrots, peas, squash} C. not a function