Based on the graphic showing the Lorenz Curve, what percentage of total income did the lowest 40 percent of households receive in 2017?
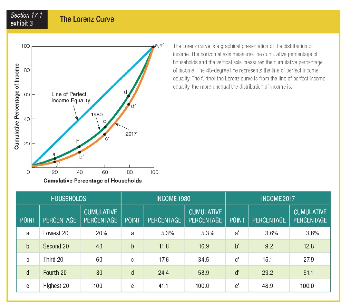
a. 3.8
b. 9.2
c. 13.0
d. 40.0
c. 13.0
You might also like to view...
If national income = $5,000 . autonomous consumption = $200, the MPC = 0.80, and intended investment demand is $800, then actual investment will
a. equal intended investment, and the economy will be in equilibrium b. be less than intended investment, and production and incomes will grow c. be greater than intended investment, and production and incomes will fall d. be less than intended investment, and production and incomes will fall e. be greater than intended investment, and production and incomes will grow
The Federal Insurance Contribution Act (FICA) tax is an example of a(n)
a. payroll tax. b. sales tax. c. farm subsidy. d. income subsidy.
Suppose that over the past year, the real interest rate was 6 percent and the inflation rate was 4 percent. It follows that
a. the dollar value of savings increased at 6 percent, and the purchasing power of savings increased at 2 percent. b. the dollar value of savings increased at 6 percent, and the purchasing power of savings increased at 10 percent. c. the dollar value of savings increased at 10 percent, and the purchasing power of savings increased at 2 percent. d. the dollar value of savings increased at 10 percent, and the purchasing power of savings increased at 6 percent.
According to the text, which of the following is true?
A. The United States imports baseballs and exports corn. B. The United States imports auto parts and cars, but it doesn't export cars. C. The United States imports wheat, but not auto parts since it exports auto parts. D. The United States imports paper, but not computers since it exports computers.