The graph for a monopolist’s profits shows that at output QM (100) and price PM ($6) the firm’s total revenue is ______.
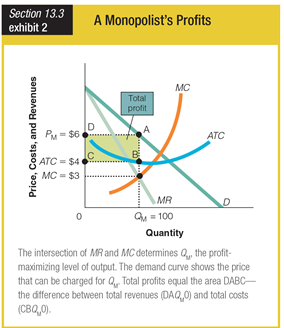
a. $100
b. $400
c. $600
d. $800
c. $600
You might also like to view...
What is the goal of fiscal policy, and what tools have policymakers traditionally used to conduct fiscal policy?
What will be an ideal response?
A permanent reduction in planned real investment spending leads to
A) a more than proportional increase in real GDP. B) a more than proportional decrease in real GDP. C) a less than proportional decrease in real GDP. D) a proportional decrease in real GDP.
In the Keynesian range, the:
a. Aggregate supply curve is vertical. b. Aggregate supply curve is horizontal. c. Aggregate demand curve is vertical. d. Aggregate demand curve is horizontal. e. Aggregate demand is downward-sloping.
Holding all other forces constant, if increasing the price of a good leads to a decrease in total revenue, then the demand for the good must be
a. unit elastic. b. inelastic. c. elastic. d. None of the above is correct because a price increase always leads to an decrease in total revenue.