The figure below shows the demand for meals at lunch and dinner for a proposed new restaurant. Suppose the marginal cost of a meal (both lunch and dinner) is constant at $10 per meal and marginal cost of providing the capacity is constant at $5 per meal. Once the managers have determined the profit-maximizing capacity, at dinner they will serve ________ meals and set a price of ________ per meal.
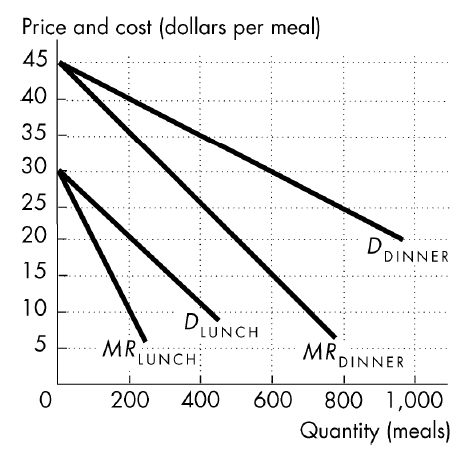
A) 200; $35 B) 800; $25 C) 200; $20 D) 600; $30
D) 600; $30
You might also like to view...
Which of the following is included in M2? I. money market mutual funds II. small-denomination certificates of deposit
A) I only B) II only C) Both I and II D) Neither I nor II
Which one of the following will not cause the production possibilities curve to shift outward?
a. increased education b. the construction of a new factory c. more tractors becoming available to farmers d. All of the above cause the production possibilities curve to shift outward.
YearCPI2010952011100201210520131042014106According to the table shown, how do we interpret what happened between 2011 and 2014? The cost of living:
A. decreased 0.98 %. B. increased 6 %. C. decreased 2 %. D. increased 1.06 %.
When comparative advantage is based on transferable factors, the law of one price tends to:
A. stabilize the advantage. B. amplify the advantage. C. erode the advantage away. D. make the advantage into an inherent comparative advantage.