Solve.On a particular day, the amount of pollution A in the air outside a home located near a factory can be modeled by the expression  , where t is the number of hours after 12 P.M.(i) Graph the equation
  .(ii) At what time of day was the pollution highest?(iii) What was the highest amount of pollution in the air during the day?(iv) In a sentence, describe the trend in pollution that you observe from the graph.
What will be an ideal response?
(i)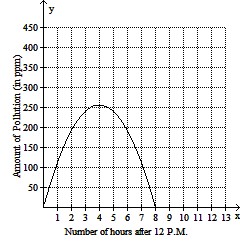
(ii) Pollution was highest at 4 P.M.
(iii) The higest amount of pollution was 256 ppm.
(iv) The amount of pollution increases between 12 P.M. and 4 P.M. and then decreases after that.
Mathematics
You might also like to view...
Estimate the slope of the curve at the indicated point.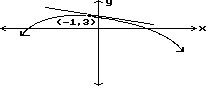
A. 2
B. - 
C. 
D. -2
Mathematics
Find the circumference of the circle. Use 3.14 or  for ? as indicated.Find the circumference. Round the answer to the nearest tenth of a unit.
A. 50.2 mi B. 3215.4 mi C. 201.0 mi D. 100.5 mi
Mathematics
Begin by graphing the standard function f(x) = x3 Then use transformations of this graph to graph the given function.h(x) = (x + 2)3
A. 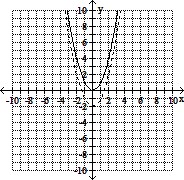
B. 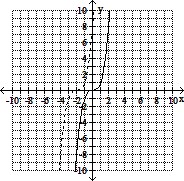
C. 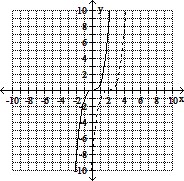
D. 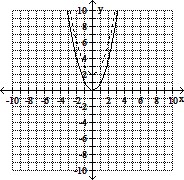
Mathematics
Simplify the complex rational expression.
A. 
B.  x +
x + 
C. 
D. 
Mathematics