The figure above shows that as a result of the tariff, the quantity of T-shirts produced in the United States ________, and the quantity of T-shirts imported ________
A) increases by 15 million per year; decreases by 30 million per year
B) increases by 15 million per year; increases by 15 million per year
C) decreases by 15 million per year; decreases by 30 million per year
D) decreases by 30 million per year; increases by 30 million per year
E) does not change; decreases by 15 million per year
A
You might also like to view...
The existence of scarcity in economics comes from
A) resources being limited in supply. B) people being stupid. C) governments being corrupt. D) the rich controlling most resources.
If cars are normal goods, a fall in income will
a. Increase the demand for cars b. Decrease the demand for cars c. Have no effect on the demand for cars d. None of the above
Policies that increase research and development spending will increase the rate of technological change and thus shift the production function up vertically
a. True b. False
Refer to the given figure.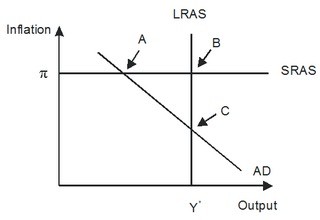 In response to gradually falling inflation, this economy will eventually move from its short-run equilibrium to its long-run equilibrium. Graphically, this would be seen as:
A. aggregate demand shifting rightward. B. short-run aggregate supply shifting downward. C. aggregate demand shifting leftward. D. long-run aggregate supply shifting leftward.