Provide a short answer.Suppose the population of deer fluctuates over time. The population increases in the summer and decreases in the winter. It also varies over many years as well. If you looked at the graph of population versus time, would this relation be a function? Why or why not?
What will be an ideal response?
This would be a function because at any given time there is only one possible population. Despite the fact that the population can reach the same level several times this is still a function, but for each point in time, there can be no more than one population.
You might also like to view...
Give an appropriate answer.Given the function f(x, y) and the positive number ? as in the formal definition of a limit, find a positive number ? as in the definition that insures  < ?.f(x, y) = (1 + cos x)(x + y); ? = 0.16
What will be an ideal response?
Find the solution set for the equation.|x - 8| = |9 - x|
A. {17}
B. 
C. ?
D. 
Solve the problem.Juanita is having her yard landscaped. She obtained an estimate from two landscaping companies. Company A gave an estimate of $240 for materials and equipment rental plus $65 per hour for labor. Company B gave an estimate of $320 for materials and equipment rental plus $55 per hour for labor. We can represent this situation with the system of linear equationsc = 240 + 65xCompany Ac = 320 + 55xCompany Bwhere c is the total cost and x is the number of hours of labor. Graph the system. What is the x-coordinate of the intersection point of the graphs? Describe what this x-coordinate means in practical terms.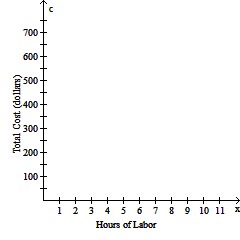
A. 7; there is a number of hours of labor, for which both companies charge $700. B. 11; for 11 hours of labor, both companies charge the same. C. 7; for 7 hours of labor, both companies charge the same. D. 8; for 8 hours of labor, both companies charge the same.
The graph below shows the percentage of students enrolled in the College of Engineering at State University. Use the graph to answer the question.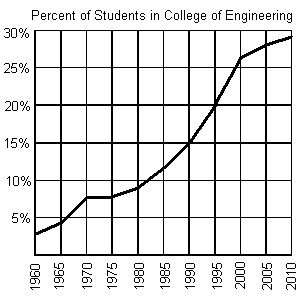 Does the graph represent a function?
A. Yes B. No