The following double-bar graph illustrates the revenue for a company for the four quarters of the year for two different years. Use the graph to answer the question. 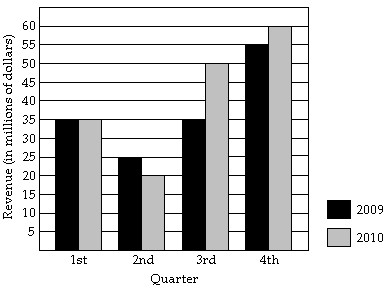 How much less revenue was generated from 2009 to 2010 in the first half of the year
  quarters)?
A. $10,000,000
B. $5,000,000
C. $1,000,000
D. $15,000,000
Answer: B
Mathematics
You might also like to view...
Use the Quotient to a Power Rule to simplify. All variables are nonzero. 5
5
A. 
B. 
C. 
D. 
Mathematics
Multiply. Write your answer in a + bi form.(3 - 2i)(9 + 5i)
A. 37 + 3i B. 17 - 33i C. 37 - 3i D. -10i2 - 3i + 27
Mathematics
Find the expected value.A fair coin is tossed three times, and a player wins $3 if 3 tails occur, wins $2 if 2 tails occur and loses $3 if no tails occur. If one tail occurs, no one wins. What is the expected value of the games?
A. $0.75 B. $2.00 C. -$3.00 D. $3.00
Mathematics
Solve the problem.Find the remainder when x34 - 16 is divided by x - 1.
A. 15 B. -15 C. 17 D. -17
Mathematics