Solve the problem.The graph depicts a relationship between scores achieved on an unspecified standardized test and family income. Suppose the score for a test is 485 when the family income is $25,000 and is 535 when the family income is $55,000. Let x be the income, in thousands, and y be the score of the test. Graph the two given pairs of incomes and scores. Assume that the relationship is linear. Draw a line though the two previous points. From your graph, estimates the score if the family income is $40,000. Label the axes, and show where the solution is located on the graph.
A. 
Standardized test score: 585
B. 
Standardized test score: 560
C. 
Standardized test score: 510
D. 
Standardized test score: 535
Answer: C
You might also like to view...
Solve the problem.Let D be the region bounded below by the xy-plane, on the side by the cylinder  and on top by the paraboloid
  . Set up the triple integral in cylindrical coordinates that gives the volume of D using the order of integration
  .
.
A. 
B. 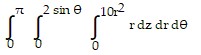
C. 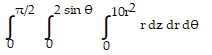
D. 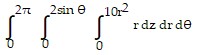
Graph the polynomial function. f(x) = -2x3(x - 3)2(x - 1)
A. 
B. 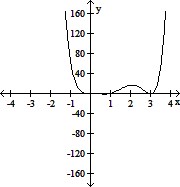
C. 
D. 
Determine if the statement is true or false. Do not use a calculator.12(45 + 25) = 45 + 25(12)
A. True B. False
If the temperature is constant, then the atmospheric pressure P (in pounds/square inch) varies with the altitude above sea level h in accordance with the law  where p?0 is the atmospheric pressure at sea level and k is a constant.
?
If the atmospheric pressure is 17 lb/in.2 at sea level and 11.5 lb/in.2 at 5,000 ft, how fast is the atmospheric pressure changing with respect to altitude at an altitude of 15,000 ft? Give the answer to four decimal places.
?
where p?0 is the atmospheric pressure at sea level and k is a constant.
?
If the atmospheric pressure is 17 lb/in.2 at sea level and 11.5 lb/in.2 at 5,000 ft, how fast is the atmospheric pressure changing with respect to altitude at an altitude of 15,000 ft? Give the answer to four decimal places.
?
A. 0.0004 lb/in.2/ft B. 0.0006 lb/in.2/ft C. 0.0003 lb/in.2/ft D. 0.0007 lb/in.2/ft E. 0.0005 lb/in.2/ft