The bar graph below represents various colors of cars sold. Use the graph to answer the question(s). 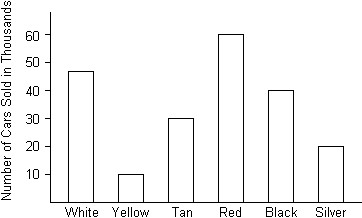 Estimate how many more black cars were sold than silver cars.
A. 21,000
B. 31,000
C. 14,000
D. 11,000
Answer: A
Mathematics
You might also like to view...
Decide whether or not the given equation is an identity. -
-  = csc ?t - sin ?t
A. Yes B. No
Mathematics
Evaluate the improper integral or state that it is divergent.
A. 13 B. 0 C. -13 D. Divergent
Mathematics
Insert <, >, or = to form a true statement.0.3  0.0563
A. > B. = C. <
Mathematics
Perform the operation indicated. Simplify. -
- 
A. - 
B. 
C. - 
D. 
Mathematics