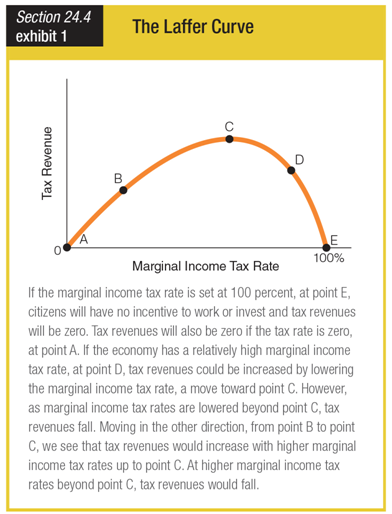
On the graph showing the Laffer curve, at point E, ______.
a. the incentive to work is highest
b. the incentive to work is eliminated
c. economic resources are fully invested
d. the rate of saving reaches its peak
b. the incentive to work is eliminated
You might also like to view...
Nash equilibrium is:
a. where one player maximizes his payoff and the other doesn't b. where each player maximizes the expected payoff c. similar to a dominant strategy d. difficult to determine
A production possibilities curve shows the various combinations of two outputs that: a. consumers would like to consume. b. producers would like to produce
c. an economy can produce. d. an economy should produce.
Using carefully-labeled graphs, explain how an individual demand curve is derived from the utility-maximizing behavior of a consumer.
What will be an ideal response?
Of all the money spent on farm price supports, about ______ percent goes to large corporate farms.
A. 25 B. 50 C. 75 D. 95