Solve the problem.The following table shows the median number of hours of leisure time that Americans had each week in various years. (i) Use a graphing calculator to fit a quadratic sequence regression function an = an2 + bn + c to the data, where n is the number of years after 1973. (ii) Estimate the median number of leisure hours per week in 2000 and 2010. Round to the nearest hour.
A. (i) an = -0.021n2 + 1.44n + 28.07;
(ii) 52 hours; 53 hours
B. (i) an = 0.04n2 - 1.21n + 26.03;
(ii) 23 hours; 36 hours
C. (i) an = 0.021x2 - 1.44x + 28.07;
(ii) 4 hours; 4 hours
D. (i) an = -0.04x2 + 1.21x + 26.03;
(ii) 30 hours; 16 hours
Answer: B
You might also like to view...
Solve the problem.A company predicts that sales will increase rapidly after a new product is released, with the number of units sold weekly modeled by N = 8000(0.2)0.5t, where t represents the number of weeks after the product is released. How many units per week were sold at the end of the first week of the campaign?
A. 4293 units B. 3578 units C. 2862 units D. 5367 units
Find the equations of any vertical asymptotes.f(x) = 
A. y = 3, y = -6 B. x = 3, x = -6 C. y = 4 D. x = -3, x = 6
Find the particular solution to the difference equation 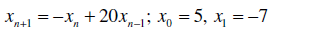
What will be an ideal response?
The frequency of repair for the trucks owned by a trucking firm over a five-year period has been tabulated. The results are shown in the frequency distribution below. Find the mean number of repairs over the five-year period. Please round your answer to the nearest tenth. Time RepairedFrequency1 - 3 223 - 5 535 - 7 717 - 9 1089 - 11 10211 - 13 12013 - 15 14615 - 17 13517 - 19 9819 - 21 8421 - 23 4223 - 25 1225 - 27 8
A. mean = 11.9 B. mean = 10.0 C. mean = 11.6 D. mean = 13.4 E. mean = 13.1