Solve the problem.The following graph shows the private, public and total national school enrollment for students for select years from 1970 through 2000.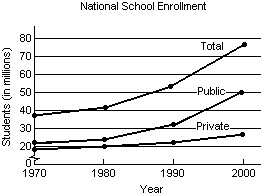 i) How is the graph for total school enrollment, T, determined from the graph of the private enrollment, r, and the public enrollment, u?ii) During which 10-year period did the total number of students enrolled increase the least?iii) During which 10-year period did the total number of students enrolled increase the most?
A.
| i) | T is the sum of r and u. |
iii) 1970-1980
B.
| i) | T is the sum of r and u. |
iii) 1980-1990
C.
| i) | T is the sum of r and u. |
iii) 1990-2000
D.
| i) | T is the difference of r and u. |
iii) 1990-2000
Answer: C
Mathematics
You might also like to view...
Find a sample space for an experiment of rolling a dice. ?
A. {1, 2, 3, 4, 5, 6} B. {0, 1, 2, 3, 4, 5, 6} C. {0, 1, 2, 3, 4, 5}
Mathematics
Solve the problem.Three islands have a total area of 5180 mi2. Island A is 3247 mi2 larger than island B, and island B is 167 mi2 larger than island C. What is the area of each island?
A. A: 3947 mi2; B: 867 mi2; C: 533 mi2 B. A: 4114 mi2; B: 867 mi2; C: 523 mi2 C. A: 4114 mi2; B: 700 mi2; C: 523 mi2 D. A: 3947 mi2; B: 700 mi2; C: 533 mi2
Mathematics
Find the value of the permutation.P(5, 1)
A. 120 B. 24 C. 1 D. 5
Mathematics
Convert the degree measure to radians. Leave answer as a multiple of ?.1080°
A. 
B. 
C. 6?
D. 12?
Mathematics