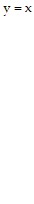
Use the graph of the function f to draw the graph of the inverse function f-1. 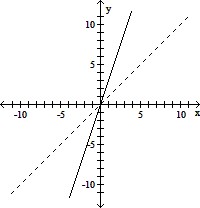
A. 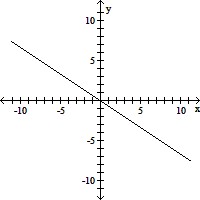
B. 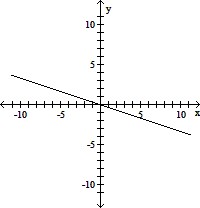
C. 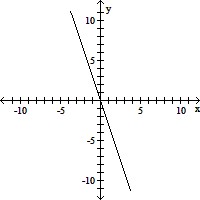
D. 
Answer: D
You might also like to view...
Solve the problem.Find equations for the horizontal and vertical tangent lines to the curve 

A. Horizontal: y = 0 at (0, 0),  at
at  ,
,  at
at  ; vertical:
  at
at  ,
,  at
at 
 at
at 
B. Horizontal: y = 0 at (0, 0), y =  at
at  ,
,  at
at  ; vertical:
  at
at  ,
,  at
at 
 at
at 
C. Horizontal: y =  at
at  ,
,  at
at  ; vertical:
  at
at  ,
,  at
at 
 at
at 
D. Horizontal:  at
at  ,
,  at
at  ; vertical: x = 0 at
 at
at  ,
,  at
at 
Let  . Find the domain of the function.
?
. Find the domain of the function.
?
 ?
Please give the answer in interval notation.
?
Please give the answer in interval notation.
What will be an ideal response?
On each of three consecutive days the NationalWeather Service announces that there is a 50-50 chance of rain. Assuming that the National Weather Service is correct, what is the probability that it rains on at most one of the three days? Justify your answer. (Hint: Represent the outcome that it rains on day 1 and doesn’t rain on days 2 and 3 as RNN.)
What will be an ideal response?
Express as a single logarithm, and, if possible, simplify.logw (x2 - 4) - logw (x - 2)
A. logw (x2 - 4)(x - 2)
B. logw (x + 2)
C. logw 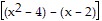
D. 