Identify the graph of the function 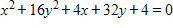 .
.
?
A. The graph of this equation is a hyperbola centered at  with transverse axis parallel to the x-axis.
B. The graph of this equation is a hyperbola centered at  with transverse axis parallel to the y-axis.
C. The graph of this equation is an ellipse centered at  with major axis parallel to the x-axis.
D. The graph of this equation is an ellipse centered at  with major axis parallel to the x-axis.
E. The graph of this equation is an ellipse centered at  with major axis parallel to the y-axis.
Answer: C
You might also like to view...
Express the integrand as a sum of partial fractions and evaluate the integral.
A. tan-1  -
-  -
-  + C
+ C
B.  tan-1
tan-1  + ln
+ ln  -
-  + C
+ C
C.  tan-1
tan-1  +
+  -
-  + C
+ C
D.  tan-1
tan-1  -
-  +
+  + C
+ C
Solve the problem.A ship sailing parallel to shore sights a lighthouse at an angle of 15° from its direction of travel. After traveling 2 miles farther, the angle is 25°. At that time, how far is the ship from the lighthouse?
A. 1.22 mi B. 2 mi C. 4.87 mi D. 2.98 mi
Perform the indicated operation and simplify. Write the answer in the form a + bi.(12 - 9i) - (1 - 2i)
A. 13 - 7i B. -13 - 11i C. 11 - 11i D. 11 - 7i
Solve the problem.The population P of a predator mammal depends upon the number x of a smaller animal that is its primary food source. The population s of the smaller animal depends upon the amount a of a certain plant that is its primary food source. If  and
and  what is the relationship between the predator mammal and the plant food source?
A. P(s(a)) = 4a2 + 8a + 13 B. P(s(a)) = 12a2 + 12a + 21 C. P(s(a)) = 12a2 + 24a + 21 D. P(s(a)) = 6a + 11