Refer to the graph shown. After an increase in supply, the market is in equilibrium where the demand curve intersects S1. In this new equilibrium, producer surplus is equal to: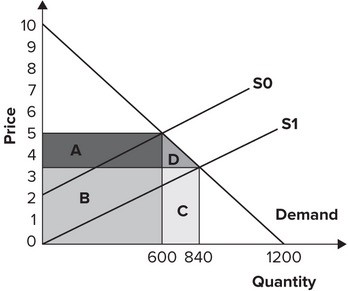
A. 1,260.
B. 900.
C. 2,520.
D. 2,940.
Answer: A
You might also like to view...
Refer to the Article Summary. Use a graph to illustrate average total cost curves for Macy's before and after closing the 35 to 40 stores. Assume that after closing the stores, Macy's will be producing at minimum average total cost
What will be an ideal response?
The real bills doctrine was the guiding principle for the conduct of monetary policy during the
A) 1910s. B) 1940s. C) 1950s. D) 1960s.
On the graph above, if the U.S. economy is at point B in 2009, then the economy in 2010 is best represented by point ________
A) A B) B C) C D) D E) any of the labeled points is as good as the others
If the government decreased urban welfare payments by a dollar for every dollar increase in farm subsidies, which of the following is the likely net effect?
a. An increase in the budget deficit because government spending has increased b. A decrease in the budget deficit because transfer payments are not included in the government's budget c. An increase in the budget deficit because transfer payments have increased d. An increase in the budget deficit because farm subsidies are transfer payments but urban welfare payments are not e. No change in the budget deficit