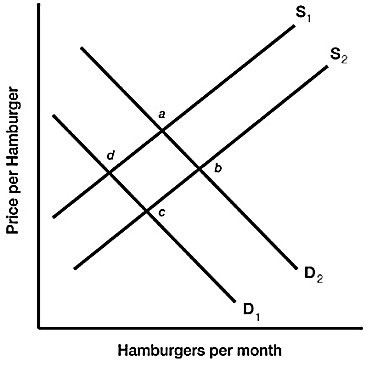
 Figure 3.6 illustrates a set of supply and demand curves for hamburgers. A decrease in supply and a decrease in demand are represented by a movement from:
A. point c to point a.
B. point b to point d.
C. point d to point a.
D. point a to point b.
Answer: B
You might also like to view...
What is utilitarian justice?
What will be an ideal response?
A firm is currently producing at the point where MC = MR. The situation for the firm at this point is P = $5, Q = 100, ATC = $6, AVC = $5.50. What do you recommend this firm do?
A) Increase production above the current output rate, because MC = MR at this rate of output. B) Continue to produce the current output rate, because P > AVC. C) Shut down, because AVC > P. D) Shut down, because ATC > P.
Suppose that the average price of refrigerators has fallen over the past few years, yet the refrigerator companies have offered more and more of them for sale. Does this mean that the supply curve for refrigerators is downward sloping? Explain
The tit-for-tat strategy only works for a prisoner's dilemma that:
A. is repeated. B. is played only one time. C. has only one Nash equilibrium. D. does not have a Nash equilibrium.