Use the following graph to answer the question.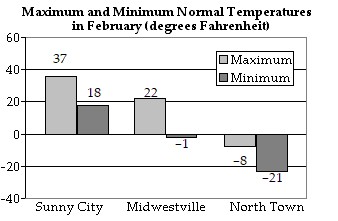 What is the minimum normal February temperature in Midwestville?
A. -21°F
B. 18°F
C. 22°F
D. -1°F
Answer: D
Mathematics
You might also like to view...
Solve and check your answer.4n + n = 30
A. 6 B. 150 C. 8 D. 7
Mathematics
Use the circle graph to solve the problem.A survey of the 7970 vehicles on the campus of State University yielded the following circle graph.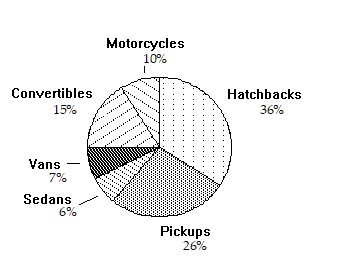 What percent of the vehicles are hatchbacks?
A. 287% B. 7% C. 36% D. 26%
Mathematics
Use the discriminant to determine the number of real solutions.4y2 = -5y - 3
A. Two real solutions B. One real solution C. No real solutions
Mathematics
Use the graph to answer the question.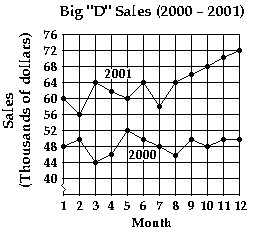 Write a simplified ratio in three different ways to represent Big "D" sales in January 2000 to sales in January 2001.
A. 4 to 5, 4:5, 
B. 4 out of 9, 4;9, 
C. 5 to 4, 5;4, 
D. 4 out of 5, 4:5, 
Mathematics