Refer to the information provided in Figure 10.2 below to answer the question(s) that follow. 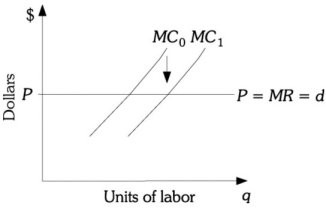 Figure 10.2 Refer to Figure 10.2. This firm's marginal cost curve has shifted from MC0 to MC1. A profit-maximizing firm should ________ the amount of output produced and ________ its demand for labor.
A. increase; decrease
B. keep constant; increase
C. decrease; decrease
D. increase; increase
Answer: D
You might also like to view...
The potential for a financial breakdown at one financial institution to spread throughout the financial system is known as a
A) lending risk. B) systemic risk. C) moral hazard. D) liquidity risk.
In an ultimatum game
A) non-profit-maximizing behavior often occurs. B) players move simultaneously. C) players act in an economically rational way. D) one player receives nothing.
If prices have been rising since the base year for GDP (which was years ago), which will be smaller?
A. nominal GDP B. real GDP C. cannot say
Refer to the information provided in Table 6.1 below to answer the question(s) that follow. Table 6.1Number of Hamburgers per DayTotal UtilityMarginal Utility130?252?367?476?5?4Number ofSodas per DayTotal UtilityMarginal Utility120?235?347?457?5?7Refer to Table 6.1. If the price of a soda is $2, the price of a hamburger is $6, and George has $14 of income, George's utility-maximizing combination of sodas and hamburgers per day is
A. 4 sodas and 1 hamburger. B. 3 sodas and 1.5 hamburgers. C. 1 soda and 2 hamburgers. D. indeterminate from this information.