For each data set shown by the table, a. Create a scatter plot for the data.b. Use the scatter plot to determine whether an exponential function, a logarithmic function, or a linear function is the best choice for modeling the data.Percentage of Population Living in the South Suburbs of a Large City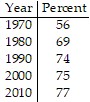
What will be an ideal response?
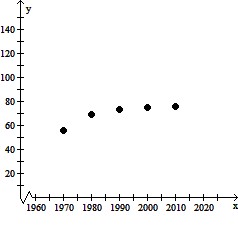
Logarithmic Function
Mathematics
You might also like to view...
Write the expression in the standard form a + bi.(9 + 7i)(3 - 4i)
A. -28i2 - 15i + 27 B. 55 - 15i C. -1 + 57i D. 55 + 15i
Mathematics
Graph the system of inequalities.2x + y ? 4y - 1 < 0
A. 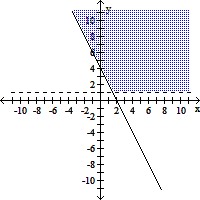
B. 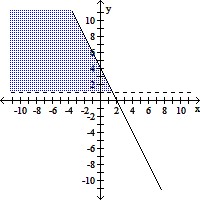
C. 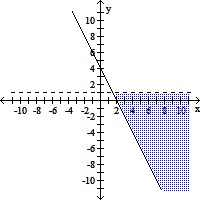
D. 
Mathematics
Solve for the indicated variable.x =  for y
for y
A. y = 2x - 2w - 2z B. y = 2x - w - z C. y = x - w - z - 2 D. y = 2x + w + z
Mathematics
Solve the inequality. Write the solution set in interval notation and graph it.-9x + 4 - 9x < 10 - 20x + 2
A. (4, ?)![]()
B. (-?, 4)![]()
C. (-?, 8)![]()
D. (8, ?)![]()
Mathematics