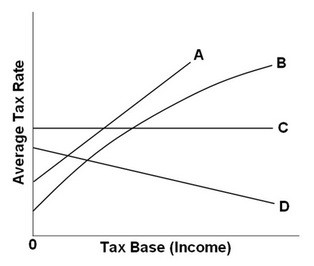
 Refer to the above graph. Which of the lines in the above diagram represent(s) a proportional tax?
A. Both A and B
B. B only
C. C only
D. D only
Answer: C
You might also like to view...
The normal life-cycle pattern of income reflects differences in earnings based on
a. race and education b. gender and education c. age and education d. race e. household size
The total fiscal expenditure in a country during a particular year was $3.5 million. If the government borrows $1.2 million to meet this expenditure, then total tax revenue was:
a. $4.7 million. b. $3.2 million. c. $2.3 million. d. $1.2 million.
The components of the expenditure method to measure GDP include all of the following EXCEPT
A. net exports B. government purchases of goods and services C. changes in the stocks of inventories D. the implicit payments for unpaid household work
The equilibrium level of real GDP is $1,000, the target full-employment level of real GDP is $1,500, and the marginal propensity to consume is 0.75. The target can be reached if government spending is:
A. increased by $100 billion. B. increased by $125 billion. C. increased by $500 billion. D. held constant.