In Figure 5.8, if the supply curve moves from S1 to S3,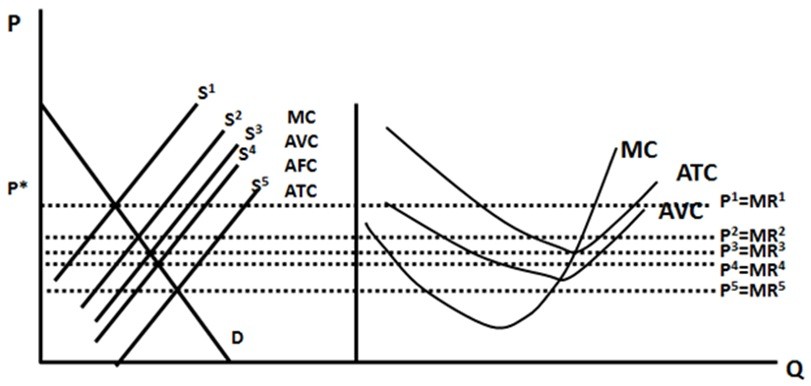
A. the firm will go from making an economic profit to a loss.
B. the firm will make a smaller economic profit than they used to.
C. the firm will go from making normal profits to a loss.
D. the firm will go from making an economic profit to a normal profit.
Answer: D
You might also like to view...
In general, as wages go up:
A. people are willing to work less. B. the opportunity cost of leisure goes up. C. the opportunity cost of leisure goes down. D. people will always work more.
Wheat is the main input in the production of flour. If the price of wheat decreases, then we would expect the
a. demand for flour to increase.
b. demand for flour to decrease.
c. supply of flour to increase.
d. supply of flour to decrease.
The total amount of producer surplus in a market is equal to
A) the difference between quantity supplied and quantity demanded. B) the area above the market supply curve and below the market price. C) the area above the market supply curve. D) the area between the demand curve and the supply curve below the market price.
You would expect the price of a share of stock to rise if
A. the price level was declining. B. the expected dividend of the stock rose. C. the economy went into recession. D. interest rates rise.