Evaluate the expression.61
A. 
B. 6
C. 1
D. -6
Answer: B
Mathematics
You might also like to view...
Solve the problem.Suppose that the population of a certain city during a certain time period can be approximated by 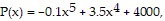 where x is time in years since 2010. By sketching a graph of P(x), estimate during what time period the population of the city would be increasing.
A. Between 2010 and 2024 B. Between 2015 and 2045 C. Between 2010 and 2038 D. Between 2015 and 2038
Mathematics
Perform the indicated operation and write the answer in simplest form.-  -
- 
A. 
B. - 
C. 
D. - 
Mathematics
Graph the compound inequality.0 ? x ? 4![]()
A. ![]()
B. ![]()
C. ![]()
D. ![]()
Mathematics
Graph the piecewise linear function.f(x) = 
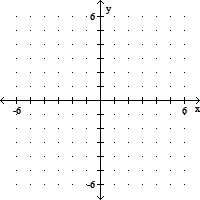
A. 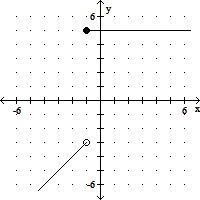
B. 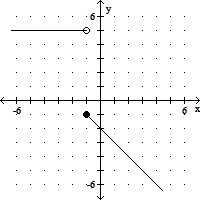
C. 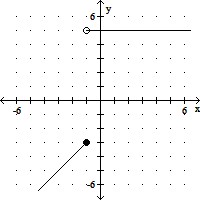
D. 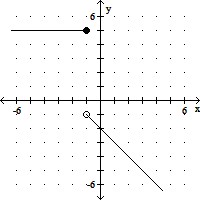
Mathematics