A graph conveys information about a cause-and-effect relationship.
Answer the following statement true (T) or false (F)
False
You might also like to view...
Based on the figure below. Starting from long-run equilibrium at point C, an increase in government spending that increases aggregate demand from AD to AD1 will lead to a short-run equilibrium at point ________ creating _____gap. 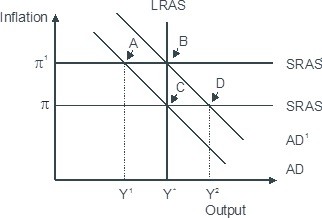
A. D; an expansionary B. B; no output C. B; expansionary D. A; a recessionary
The market demand curve for labor
A) is the same as the market demand curve for the product labor produces because it is a derived demand. B) is determined by adding up the quantity of labor demanded by each firm at each wage, holding constant the other variables that affect the willingness of firms to hire workers. C) is perfectly inelastic because there is a finite number of workers in the market for labor. D) is determined by adding up the demand for labor by each firm at each wage, holding constant the other variables that affect the willingness of firms to hire workers.
The number of people that are fired in a month is
A) a stock. B) a flow. C) both a stock and a flow. D) neither a stock nor a flow.
The output level at which a firm's long-run average total cost is minimized is known as its
a. profit-maximizing output level b. long-run marginal cost c. minimum efficient scale d. revenue maximization level e. equilibrium cost structure