Choose the graph that matches the given function.f(x) = 
A. 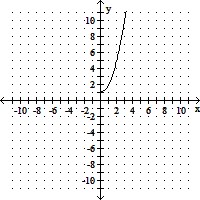
B. 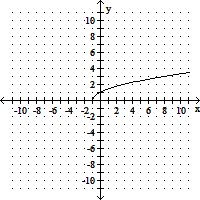
C. 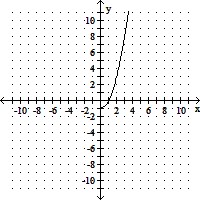
D. 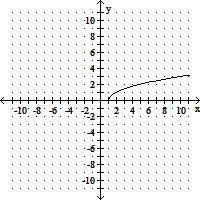
Answer: D
You might also like to view...
Graph the quadratic function. Determine the vertex, find the equation of the axis of symmetry, find any x- and y-intercepts, and state the domain and range in interval notation.f(x) = x2 - 12x + 36
A. vertex: (6, 36)
axis of symmetry: x = 6
x-intercept: none; y-intercept: 72
domain: (-?, ?); range: [36, ?)
B. vertex: (-6, 0)
axis of symmetry: x = -6
x-intercept: -6; y-intercept: 36
domain: (-?, ?); range: [0, ?)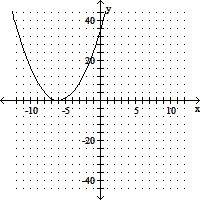
C. vertex: (6, 0)
axis of symmetry: x = 6
x-intercept: 6; y-intercept: 36
domain: (-?, ?); range: [0, ?)
D. vertex: (-6, 36)
axis of symmetry: x = -6
x-intercept: none; y-intercept: 72
domain: (-?, ?); range: [36, ?)
Use DeMoivre's Theorem to write the expression in rectangular form. 3
3
A. -4 + 4
+ 4 i
i
B. -4 - 4
- 4 i
i
C. 4 - 4
- 4 i
i
D. 4 - 4 i
i
Simplify the expression.-9(3r + 3) + 6(5r + 9)
A. 3r + 27 B. -6r - 6 C. -54r D. 3r + 3
Solve the problem.The graphs below represent the supply and demand for a product at various prices per unit. At what price does supply equal demand?
A. $900 B. $400 C. $650 D. $177