Use the x-intercepts to find the intervals on which the graph of f is above and below the x-axis.f(x) = (x - 4)3
A. above the x-axis: (-?, 4)
below the x-axis: (4, ?)
B. above the x-axis: (-?, 4), (4, ?)
below the x-axis: no intervals
C. above the x-axis: (4, ?)
below the x-axis: (-?, 4)
D. above the x-axis: no intervals
below the x-axis: (-?, 4), (4, ?)
Answer: C
You might also like to view...
In the following question(s), FN represents the Nth Fibonacci number.2F9 - 3 =
A. 6 B. 16 C. 12 D. 65 E. none of these
Use the vertical line test to determine whether the graph represents a function.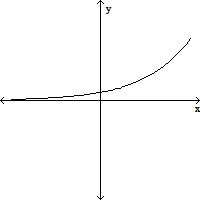
A. not a function B. function
The given Treasury bill was sold in April of this year. Find (i) the price of the T-bill, and (ii) the actual interest rate paid by the Treasury. Round dollar amounts to the nearest cent and interest rates to the nearest thousandth.Six-month $11,000 T-bill with discount rate 0.070%
A. (i) $10,999.62; (ii) About 0.007% B. (i) $10,995.38; (ii) About 0.084% C. (i) $11,003.85; (ii) About 0.07% D. (i) $10,996.15; (ii) About 0.07%
Simplify. 3
3
A. - 
B. - 
C. - 
D. 