The circle graph shows the results of the student council presidential election. The complete circular area represents 100% of the votes.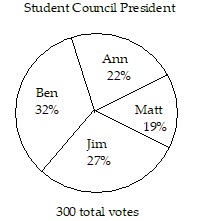 The circle graph shows what percent of the vote each person received.Who got the most votes?
A. Ben
B. Jim
C. Matt
D. Ann
Answer: A
Mathematics
You might also like to view...
Find the particular solution of the differential equation. = 6x2 - 4x + 21; y = 17 when x = 1
A. y = 2x3 - 2x2 + 21x + 4 B. y = 6x3 - 4x2 + 21x - 6 C. y = 2x3 - 4x2 + 21x - 2 D. y = 2x3 - 2x2 + 21x - 4
Mathematics
Graph.f(x) = 
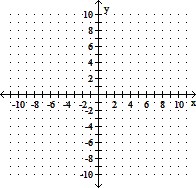
A. 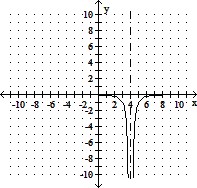
B. 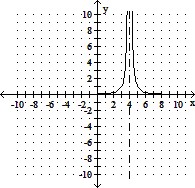
C. 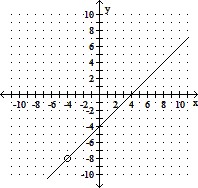
D. 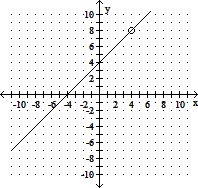
Mathematics
Solve the problem.The mean clotting time of blood is 7.35 seconds, with a standard deviation of 0.35 seconds. What is the probability that blood clotting time will be less than 7 seconds? Assume the distribution is normal.
A. 15% B. 16% C. 14% D. 84%
Mathematics
Identify the numerator and denominator.
A. Numerator: 
Denominator: 1
B. Numerator: 1
Denominator: 
C. Numerator: 27
Denominator: 19
D. Numerator: 19
Denominator: 27
Mathematics