Provide an appropriate response.The bar graph shows the median, or middlemost, household income for African-Americans and Hispanics for three selected years in a certain state.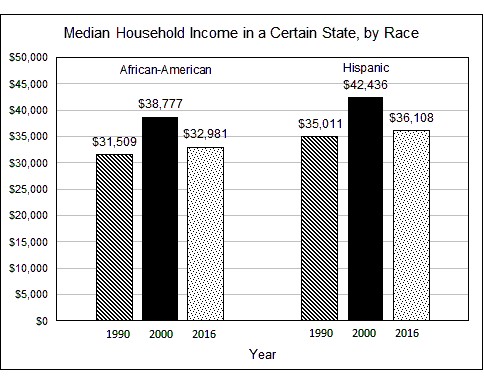 a) The formula I = 31,509 + 1789x - 106x2 models the median income of African-Americans, I, x years after 1990. Use the formula to find the median income for African-Americans in 2000.b) Does the value given by the mathematical model in part (a) underestimate or overestimate the actual median income for African-Americans shown by the bar graph. By how much?a) The formula I = 35,011 + 1859x - 112x2 models the median income of Hispanics, I, x years after 1990. Does the model
underestimate or overestimate the median income for Hispanics in 2016. By how much?
What will be an ideal response?
a) $38,799, b) overestimates by $22, c) underestimates by $25
You might also like to view...
Calculate the Huntington-Hill number.Association of 1670 members having 17 representatives on the board.
A. 9114.05 B. 10,114.05 C. 9214.05 D. 9124.05
Find the equation of a line with the given slope and y-intercept.Slope -6, y-intercept (0, 5)
A. y = -6x + 5 B. y = 5x - 6 C. y = 6x + 5 D. y = -6x - 5
Solve the system of equations using substitution.
A. x = 5, y = 10 or (5, 10) B. x = 5, y = 10; x = 5, y = -10 or (5, 10), (5, -10) C. x = 5, y = 10; x = -5, y = 0 or (5, 10), (-5, 0) D. x = 5, y = 10; x = 5, y = -10; x = -5, y = 0 or (5, 10), (5, -10), (-5, 0)
Provide an appropriate response.The number of loaves of whole wheat bread left on the shelf of a local quick stop at closing (denoted by the random variable X) varies from day to day. Past records show that the probability distribution of X is as shown in the following table. Find the probability that there will be at least three loaves left over at the end of any given day. 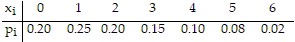
A. 0.20 B. 0.65 C. 0.35 D. 0.15