The graph above shows domestic supply and demand with trade. With trade, this country can purchase at the world price, Pw. Which of the following areas represents consumer surplus with trade?
A) Pw-A-0
B) Pw-B-Qd-0
C) P1-B-Pw
D) P1-B-A-0
C
You might also like to view...
In the figure above, assume that output is $10.5 trillion, while potential output is $12 trillion. If there is no policy intervention, we should expect ________
A) rightward shifts of IS & AD, so that both output and inflation rise B) a decrease in inflation to shift the MP curve, raising the real interest rate C) declines in both the inflation rate and the real interest rate as output rises D) a decrease in inflation to shift the AD curve, causing output to rise E) none of the above
Cost-push inflation is caused by supply shocks like higher oil prices and poor weather conditions
a. True b. False Indicate whether the statement is true or false
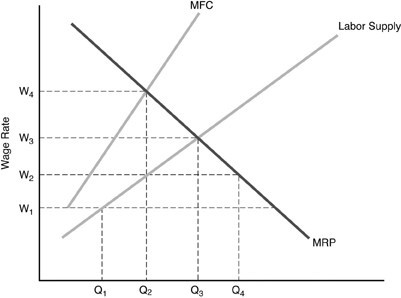 In the above figure, what is the quantity of workers that would be hired in a perfectly competitive market?
A. Q1 B. Q2 C. Q3 D. Q4
In Figure 20.2, the increase in Real GDP might reflect 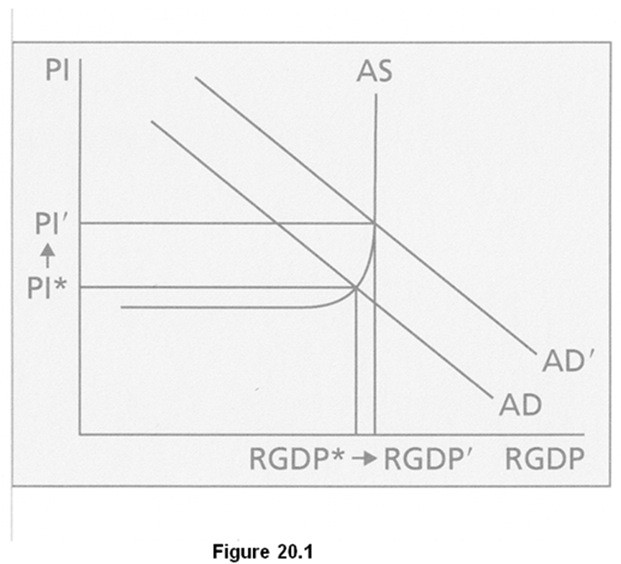
A. increased consumer confidence. B. lower marginal tax rates on capital income. C. increased standards of environmental protection. D. increased current government spending.