Refer to the information provided in Figure 1.5 below to answer the question(s) that follow.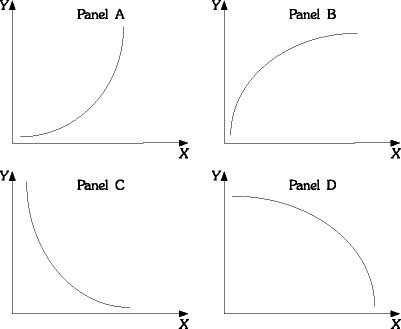 Figure 1.5Refer to Figure 1.5. In many industries, as firms produce additional units, average costs of production decline as the firm produces an additional unit, but average costs declines by a smaller and smaller amount as production continues to increase. If output is graphed on the horizontal axis and average costs are graphed on the vertical axis, the relationship between average costs and output would be like which of the following Panels?
A. A
B. B
C. C
D. D
Answer: C
You might also like to view...
According to Figure 2.5, the United States civilian labor force in June 2013 was ________
A) 157.1 million B) 144.8 million C) 245.6 million D) 100.8 million E) none of the above
Suppose a monopolist sells 10,000 units of output at $22 per unit. The firm's total revenue is
A) $2,200. B) $22,000. C) $220,000. D) $2,200,000.
Prisoners’ dilemma shows the struggle for oligopoly between which of the following?
a. Competition and market demand b. Competition and price setting c. Cooperation and competition d. Cooperation and price setting
Suppose that neither food-service workers nor retail salespeople are unionized. If food-service workers unionize, then the supply of retail salespeople will
a. rise, as will the wages of retail salespeople. b. rise, and the wages of retail salespeople will fall. c. fall, as will the wages of retail salespeople. d. fall, and the wages of retail salespeople will rise.