Use the graph to answer the question.The bar graph below shows the number of students by major in the College of Arts and Sciences. 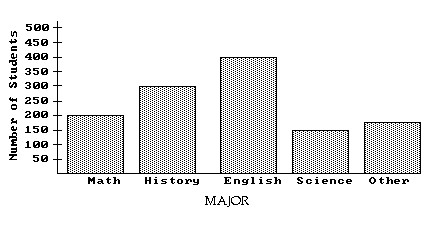 The science department spends about $400 on equipment for each student majoring in science. How much should the science department budget for equipment?
A. $40,000
B. $60,000
C. $80,000
D. $6000
Answer: B
Mathematics
You might also like to view...
Provide an appropriate response.Solve the proportion:  =
= 
A. 0.07 B. 2.4 C. 15 D. 0.42
Mathematics
Solve the linear inequality. Express the solution using set-builder notation and interval notation. Graph the solution set. x ? 3
x ? 3![]()
A.  ;
; 
![]()
B.  ;
; 
![]()
C.  ;
; 
![]()
D.  ;
; 
![]()
Mathematics
Write the decimal as a percent.4
A. 0.04% B. 0.4% C. 200% D. 400%
Mathematics
Graph the function f by starting with the graph of y = x2 and using transformations (shifting, compressing, stretching, and/or reflection).f(x) = 4x2 
A. 
B. 
C. 
D. 
Mathematics