Revenues when a firm engages in peak-load pricing based on the figure below will be: 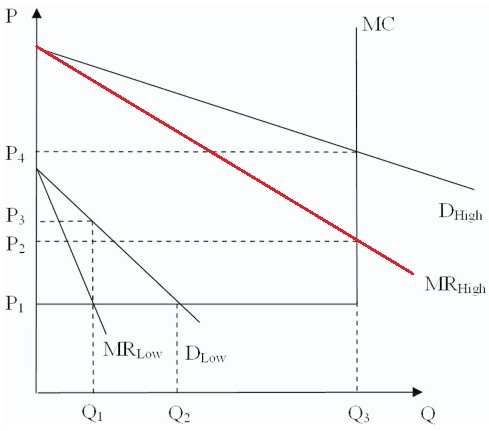
A. (P4 × Q3).
B. (P1 × Q2) + (P2 × Q3).
C. (P3 × Q1) + (P4 × Q3).
D. (P1 × Q1) + (P4 × Q3).
Answer: C
You might also like to view...
The willingness to pay for a commodity:
A) decreases as consumption of the commodity increases. B) increases as consumption of the commodity increases. C) is always less than the market price of the commodity. D) is always greater than the market price of the commodity.
The circular flow diagram is best described as a(n)
A. abstraction of little value in macroeconomics. B. exact representation of the cause and effect relationship between spending and employment. C. model that clarifies the relationship between spending and income. D. model to explain the relationship between the federal deficit and tax revenues.
A positive temporary supply side shock will:
A. increase the level of potential output in the long run. B. decrease the price level in the long run. C. increase the price level in the long run. D. have no effect in the long run.
Which of the following does the aggregate expenditure model help explain?
a. price-level changes b. stagflation c. shifts in the aggregate supply curve d. short-run business cycles