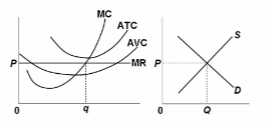
Refer to the diagrams, which pertain to a purely competitive firm producing output q and the industry in which it operates. Which of the following is correct?
A. The diagrams portray neither long-run nor short-run equilibrium.
B. The diagrams portray both long-run and short-run equilibrium.
C. The diagrams portray short-run equilibrium but not long-run equilibrium.
D. The diagrams portray long-run equilibrium but not short-run equilibrium.
Answer: C. The diagrams portray short-run equilibrium but not long-run equilibrium.
You might also like to view...
Based on the figure below. Starting from long-run equilibrium at point C, a decrease in government spending that decreases aggregate demand from AD1 to AD will lead to a short-run equilibrium at__ creating _____gap.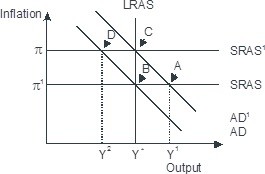
A. B; no output B. D; an expansionary C. B; recessionary D. D; a recessionary
When demand is ____ a percentage change in ____ is exactly offset by the same percentage change in ____ demanded, the net result being a constant total consumer expenditure
a. elastic; price; quantity b. unit elastic; price; quantity c. inelastic; quantity; price d. inelastic; price; quantity e. none of the above
Policymakers use taxes
a. to raise revenue for public purposes but not to influence market outcomes. b. both to raise revenue for public purposes and to influence market outcomes. c. when they realize that price controls alone are insufficient to correct market inequities. d. only in those markets in which the burden of the tax falls clearly on the sellers.
If the dollar depreciates against the euro it means that French-made goods become more expensive in the United States.
Answer the following statement true (T) or false (F)