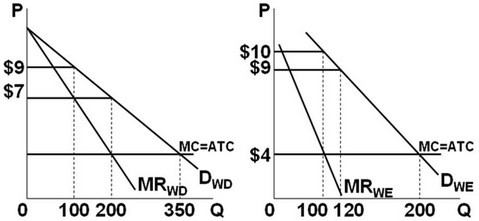
 Refer to the figures above. Suppose the graphs represent the demand for use of a local golf course for which there is no significant competition (it has a local monopoly). P denotes the price of a round of golf and Q is the quantity of rounds sold each day. If the left graph represents the demand during weekdays and the right graph the weekend demand, this profit-maximizing golf course should:
A. charge $7 for each round, regardless of the day of the week.
B. charge $7 for each round on weekdays, and $10 during the weekend.
C. charge $9 for each round, regardless of the day of the week.
D. charge $9 for each round on weekdays, and $10 during the weekend.
Answer: B
You might also like to view...
Refer to the figure below. In response to gradually falling inflation, this economy will eventually move from its short-run equilibrium to its long-run equilibrium. Graphically, this would be seen as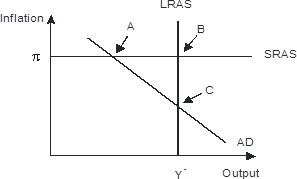
A. long-run aggregate supply shifting leftward B. Short-run aggregate supply shifting downward C. Aggregate demand shifting rightward D. Aggregate demand shifting leftward
The forecasting technique which involves the use of the least squares statistical method to examine trends, and takes into account seasonal and cyclical fluctuations, is known as
A) compound growth rate projection. B) the Delphi method. C) time series projection. D) exponential smoothing projection.
Which of the following taxes is based on the benefits-received principle?
a. corporate income taxes b. personal income taxes c. property taxes d. gasoline excise taxes e. user fees that collect the same amount from each person
The level of real GDP person
a. differs widely across countries, but the growth rate of real GDP per person is similar across countries. b. is very similar across countries, but the growth rate of real GDP per person differs widely across countries. c. and the growth rate of real GDP per person are similar across countries. d. and the growth rate of real GDP per person vary widely across countries.