Use the following diagram to answer the next question.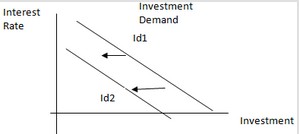 The move shown in the diagram can be explained by ________.
A. interest rates falling
B. businesses becoming pessimistic
C. businesses becoming optimistic
D. interest rates rising
Answer: B
You might also like to view...
An increase in the minimum wage to $15 per hour would lead to
A) an increase in search activity for many workers. B) a decrease in search activity for many workers. C) a decrease in unemployment. D) no change in unemployment. E) no change in employment.
According to the article, ________ in ________ have contributed to Canada's ________ change in real GDP
A) increases; consumption and exports; expected B) decreases; exports and investment; unexpected C) increases; consumption and investment; unexpected D) decreases; exports and government spending; expected
The more that Clayton earns, the higher is his average tax rate. Clayton faces a ________ income tax
A) regressive B) proportional C) progressive D) flat-rate
The growth of the Euromarkets resulted in
a. developing-country governments borrowing from European banks instead of American and Japanesebanks b. higher interest rates in Europe than in the U.S. and Japan c. a general trend toward substituting foreign aid for bank lending d. a general trend toward substituting bank lending for foreign aid e. none of the above