Use a graphing calculator to plot the data and find the quadratic function of best fit.The number of housing starts in one beachside community remained fairly level until 1992 and then began to increase. The following data shows the number of housing starts since 1992 (x = 1). Use a graphing calculator to plot a scatter diagram. What is the quadratic function of best fit?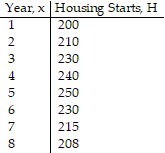
A. H(x) = 3.268x2 + 30.494x + 168.982
B. H(x) = -3.268x2 - 30.494x + 168.982
C. H(x) = -3.268x2 + 30.494x + 168.982
D. H(x) = -3.268x2 + 30.494x - 168.982
Answer: C
You might also like to view...
Which of the following is a definition of a kite? ?
A. ?A convex quadrilateral with exactly two pairs of adjacent sides that are equal in length. B. ?A concave or convex quadrilateral with exactly two pairs of adjacent sides that are equal in length. C. ?A convex quadrilateral with at least two pairs of adjacent sides that are equal in length. D. ?A concave quadrilateral with at least one pair of adjacent sides that are equal in length. E. ?A convex quadrilateral with exactly two opposite sides that are equal in length.
Solve the problem.You build an architectural model of a new office complex using a scale factor of 71. Suppose you wanted to fill both the scale model office complex and the actual office complex with marbles. How many times the number of marbles required for the model would be required for the actual building?
A. 5041 times as many B. 357,911 times as many C. 71 times as many D. 213 times as many
Solve the equation. Write the answer in a + bi form.z3 + 8i = 0
A. -2i, -  - i, -
  + i
+ i
B. -2i,  + i, -
  + i
+ i
C. 2i, -  - i,
- i,  - i
- i
D. 2i, -  + i,
+ i,  + i
+ i
Find a parametrization for the line segment beginning at P1 and ending at P2.P1(4, 2, 2) and P2
A. x = -4t + 4, y = 2, z = -  t + 2, 0 ? t ? 1
B. x = 4t, y = 2, z =  t + 3, 0 ? t ? 1
C. x = 4t, y = 2t, z =  t + 3, 0 ? t ? 1
D. x = -4t + 4, y = 2t, z = -  t + 2, 0 ? t ? 1