An experiment was done to determine the decimal reduction time of a specific population of organisms at 80oC. The data is indicated by an arrow on the graph. Which labeled line represents the likely results if the experiment was repeated using a lower temperature?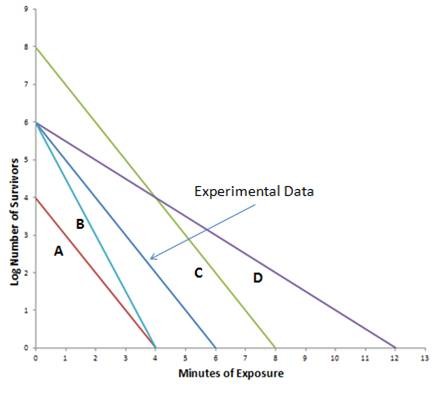
A. Line C
B. Line A
C. Line B
D. Line D
Answer: D
Biology & Microbiology
You might also like to view...
Polygyny is more likely to occur as differences in territory quality increase between territorial males
Indicate whether the statement is true or false
Biology & Microbiology
Functional class
What will be an ideal response?
Biology & Microbiology
The structural combination of DNA and protein forms ________
A) nucleoli B) RNA C) chromatin D) ribosomes
Biology & Microbiology
A class of mutations that results in multiple contiguous amino acid changes in proteins is likely to be which of the following?
A) transition B) transversion C) base analog D) recombinant E) frameshift
Biology & Microbiology