Refer to Figure 2-3. Sergio Vignetto raises cattle and llamas on his land. A portion of his land is more suitable for raising cattle, and the other portion is better suited for raising llamas
Which of the graphs in Figure 2-3 represent his production possibilities frontier that displays increasing opportunity costs?
A) Graph A
B) Graph B
C) Graph C
D) either Graph A or Graph C
E) either Graph B or Graph C
C
You might also like to view...
Which of the following best illustrates the concept of derived demand?
a. As income rises, the demand for TVs rises. b. A fall in the price of cameras will increase the demand for film. c. A fall in the demand for tires will reduce the demand for rubber. d. When the price of gasoline rises, the demand for automobile repair falls. e. If consumers expect the price of coffee to rise, demand for coffee rises.
According to the graph shown, if this economy were open to free trade, how many units would be exported?
This graph demonstrates the domestic demand and supply for a good, as well as the world price for that good.
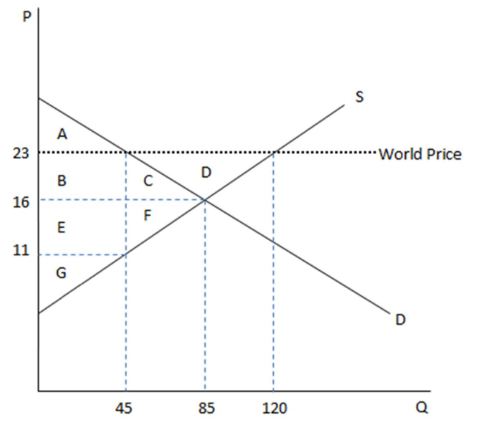
A. 35
B. 85
C. 120
D. 75
For an imaginary economy, the value of the consumer price index was 140 in 2013 and 146.5 in 2014 . The economy's inflation rate for 2014 was
a. 4.6 percent. b. 6.5 percent. c. 4.4 percent. d. 46.5 percent.
Sachs and Warner found a strong correlation between a(n) ______ response to trade and economic growth.
Fill in the blank(s) with the appropriate word(s).