Use the figure below to answer the following question.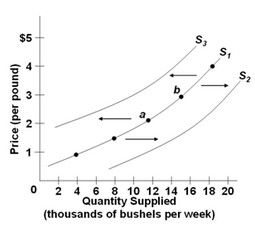 The diagram shows three supply curves for apples. Which of the following would cause the supply of apples to shift from S1 to S3?
A. a new bacteria that destroys apple crops
B. a decrease in the price of apples
C. an increase in the number of acres of farmland allocated to apple trees
D. a new genetically modified apple seed that is resistant to drought
Answer: A
You might also like to view...
When the dollar appreciates, the cost to Americans of foreign goods
A. rises and the CPI falls. B. rises and the CPI rises. C. falls and the CPI rises. D. falls and the CPI falls.
Putting money into mental categories can:
A. cause people to take risks they wouldn't otherwise take. B. help people organize their expenditures. C. cause irrational behavior. D. All of these are true.
Answer the following statements true (T) or false (F)
1. According to the Department of Commerce, a person living alone constitutes a single-person family. 2. Statistics indicate that because of government transfer programs, households in the four lower quin tiles now receive a much larger share of aggregate income than in 1970. 3. The Lorenz curve measures the degree to which a nation’s income is distributed. 4. The Lorenz curve measures the per capital annual income of individuals. 5. The value of the Gini coefficient has increased since the 1970s.
Saving to meet long-term objectives-such as retirement, college attendance, or to purchase a home,-is called ________ saving.
A. public B. precautionary C. life-cycle D. bequest