Graphical Analysis: The graph in the figure shows the position of a particle as a function of time as it travels along the x-axis.(a) What is the average speed of the particle between t = 2.0 s and t = 4.0 s?(b) What is the average velocity of the particle between t = 2.0 s and t = 4.0 s?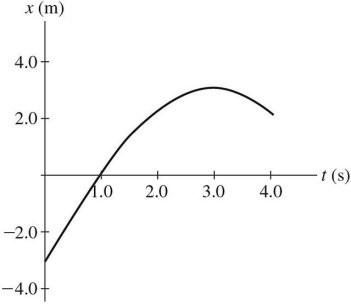
What will be an ideal response?
(a) 1.0 m/s (b) 0 m/s
You might also like to view...
Your Local Sky
a. Where is the north (or south) celestial pole in your sky? b. Describe the meridian in your sky. c. Describe the celestial equator in your sky. d. What is the range of declinations that makes a star circumpolar in your sky? Explain. e. Describe the path of the Sun through your sky on the fall equinox. f. Describe the path of the Sun through your sky on the winter solstice.
The most severe mass extinction during the past 500 million years occurred at the end of which geological period?
A) Devonian B) Triassic C) Permian D) Cretaceous
A 0.250-kg stone is attached to an ideal spring and undergoes simple harmonic oscillations with a period of 0.640 s. What is the force constant (spring constant) of the spring?
A) 2.45 N/m B) 12.1 N/m C) 24.1 N/m D) 0.102 N/m E) 0.610 N/m
In expressions like ?v and ?t? ? stands for
a. "change in" b. "triangle" c. a constant of proportionality d. a variable