Refer to the graphs, in which the numbers in parentheses near the AD1, AD2, and AD3 labels indicate the level of investment spending associated with each curve, respectively. All numbers are in billions of dollars. The interest rate and the level of investment spending in the economy are at point B on the investment demand curve. To achieve the long-run goal of a noninflationary full-employment output Qf in the economy, the Fed should:
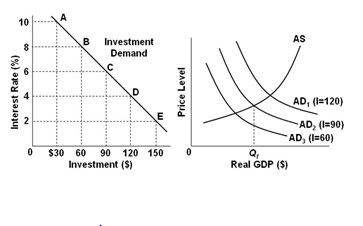
A. Decrease the interest rate from 10 to 8 percent
B. Decrease the interest rate from 8 to 6 percent
C. Decrease the interest rate from 6 to 4 percent
D. Increase investment spending from $30 to $60 billion
B. Decrease the interest rate from 8 to 6 percent
You might also like to view...
Suppliers with a high supply elasticity will bear a ______ tax incidence, while suppliers with a low supply elasticity will bear a ______ tax incidence
A) lower; higher B) higher; lower C) lower or no; higher or full D) A and C
A tax system in which the tax rate on everyone's first $10,000 of income is 10 percent, the tax rate on everyone's second $10,000 of income is 15 percent, and the tax rate on all income over $20,000 is 25 percent is a(n):
A. proportional tax. B. equitable tax. C. progressive tax. D. unit tax.
Refer to the given figure.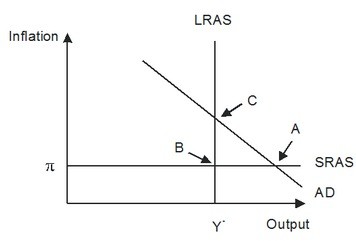 In response to gradually falling inflation, this economy will eventually move from its short-run equilibrium to its long-run equilibrium. Graphically, this would be seen as:
A. short-run aggregate supply shifting downward. B. short-run aggregate supply shifting upward. C. aggregate demand shifting leftward. D. long-run aggregate supply shifting leftward.
The aggregate demand curve of an economy _____
Fill in the blank(s) with the appropriate word(s).