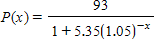
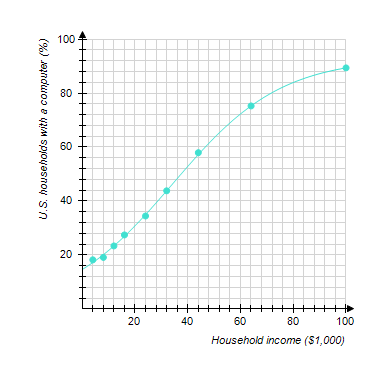
The following graph shows the actual percentage of U.S. households with a computer as a function of household income (the data points) and a logistic model of these data (the curve). The logistic model is
?
?
where x is the household income in thousands of dollars. For low incomes, the logistic model is approximately exponential. Which exponential model best approximates P(x) for small x? Round the coefficients to the nearest hundredth.
?
?
A. 
B. ?
C. ?
D. ?
E. ?
Answer: D
You might also like to view...
If r(t) is the position vector of a particle in the plane at time t, find the indicated vector.Find the acceleration vector.r(t) = (3 ln(2t))i + (6t3)j
A. a =  i + 18tj
B. a =  t-2i + 36tj
C. a = -  t-2i + 36tj
D. a = -  i + 36tj
Provide an appropriate response.Perform the indicated operations: 3 - (-5)(2) + 4 -  2 -
2 -  (3) + 14
Fill in the blank(s) with the appropriate word(s).
Translate using numbers and symbols.The difference of nineteen and x
A. 19 - x B. 19 ÷ x C. 20 - x D. x - 19
Determine whether or not the relationship shown in the table is a function. Does the table define the average final exam score as a function of the number of classes missed?
A. Yes B. No